For Run History from live users after publishing, see Logs.
Application Run History
Each workflow run creates a complete log entry. Click any entry to see three sections: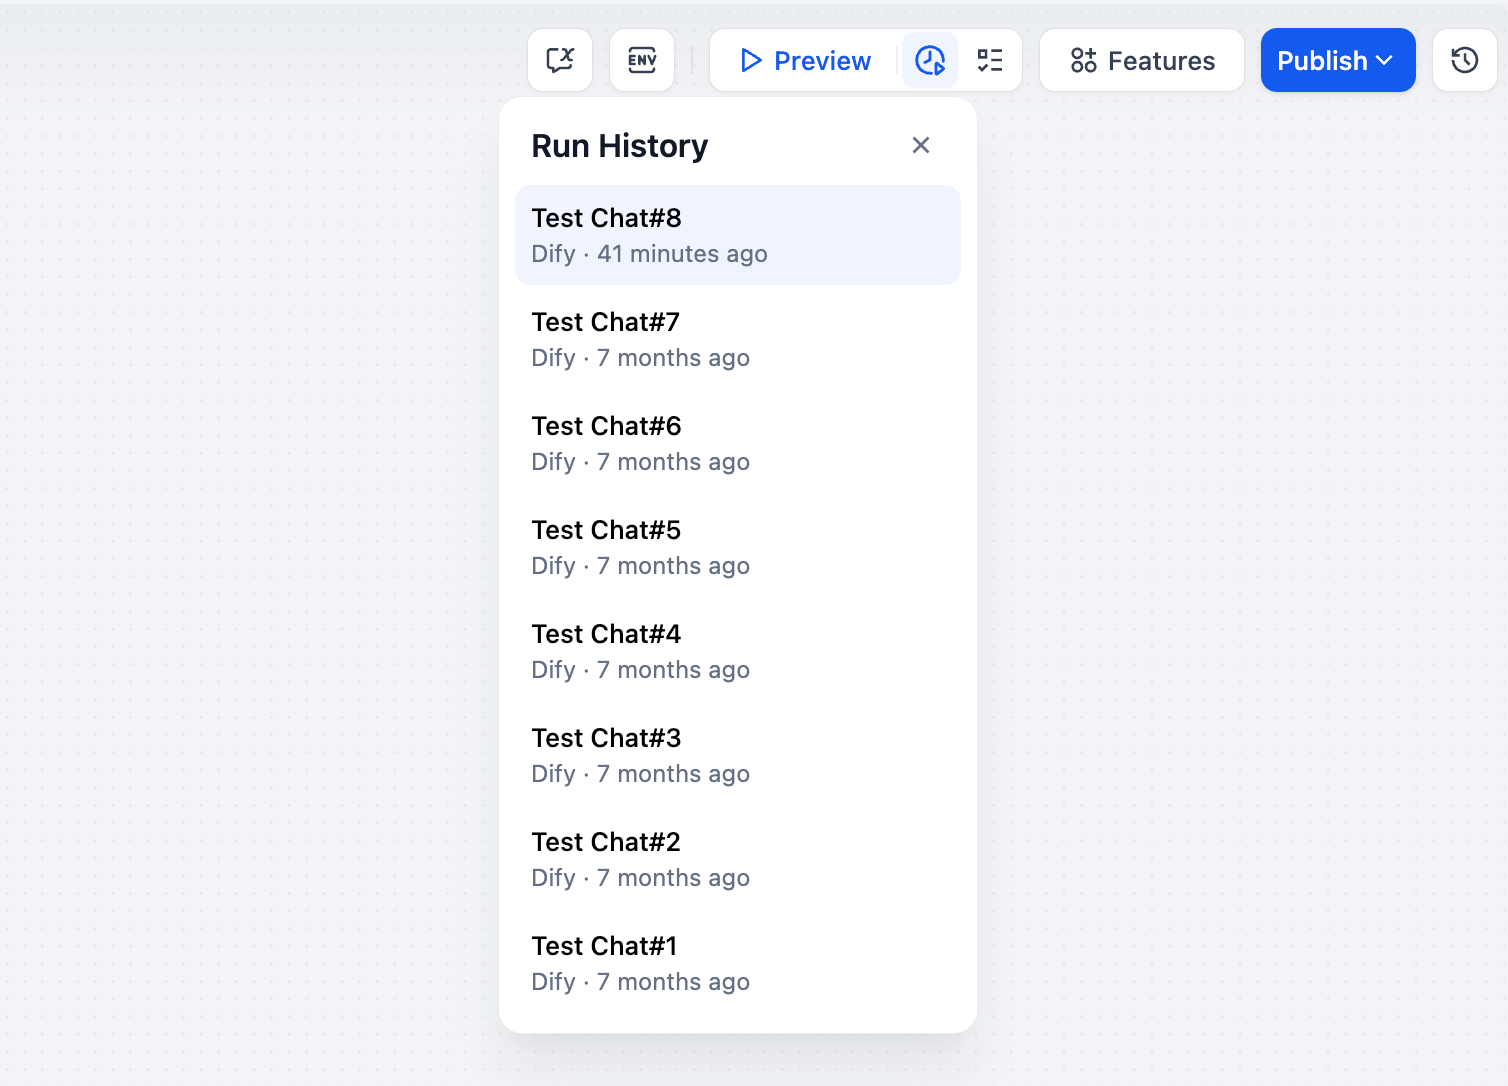
Result
Shows the final output that users see. If the workflow failed, you’ll see error messages here.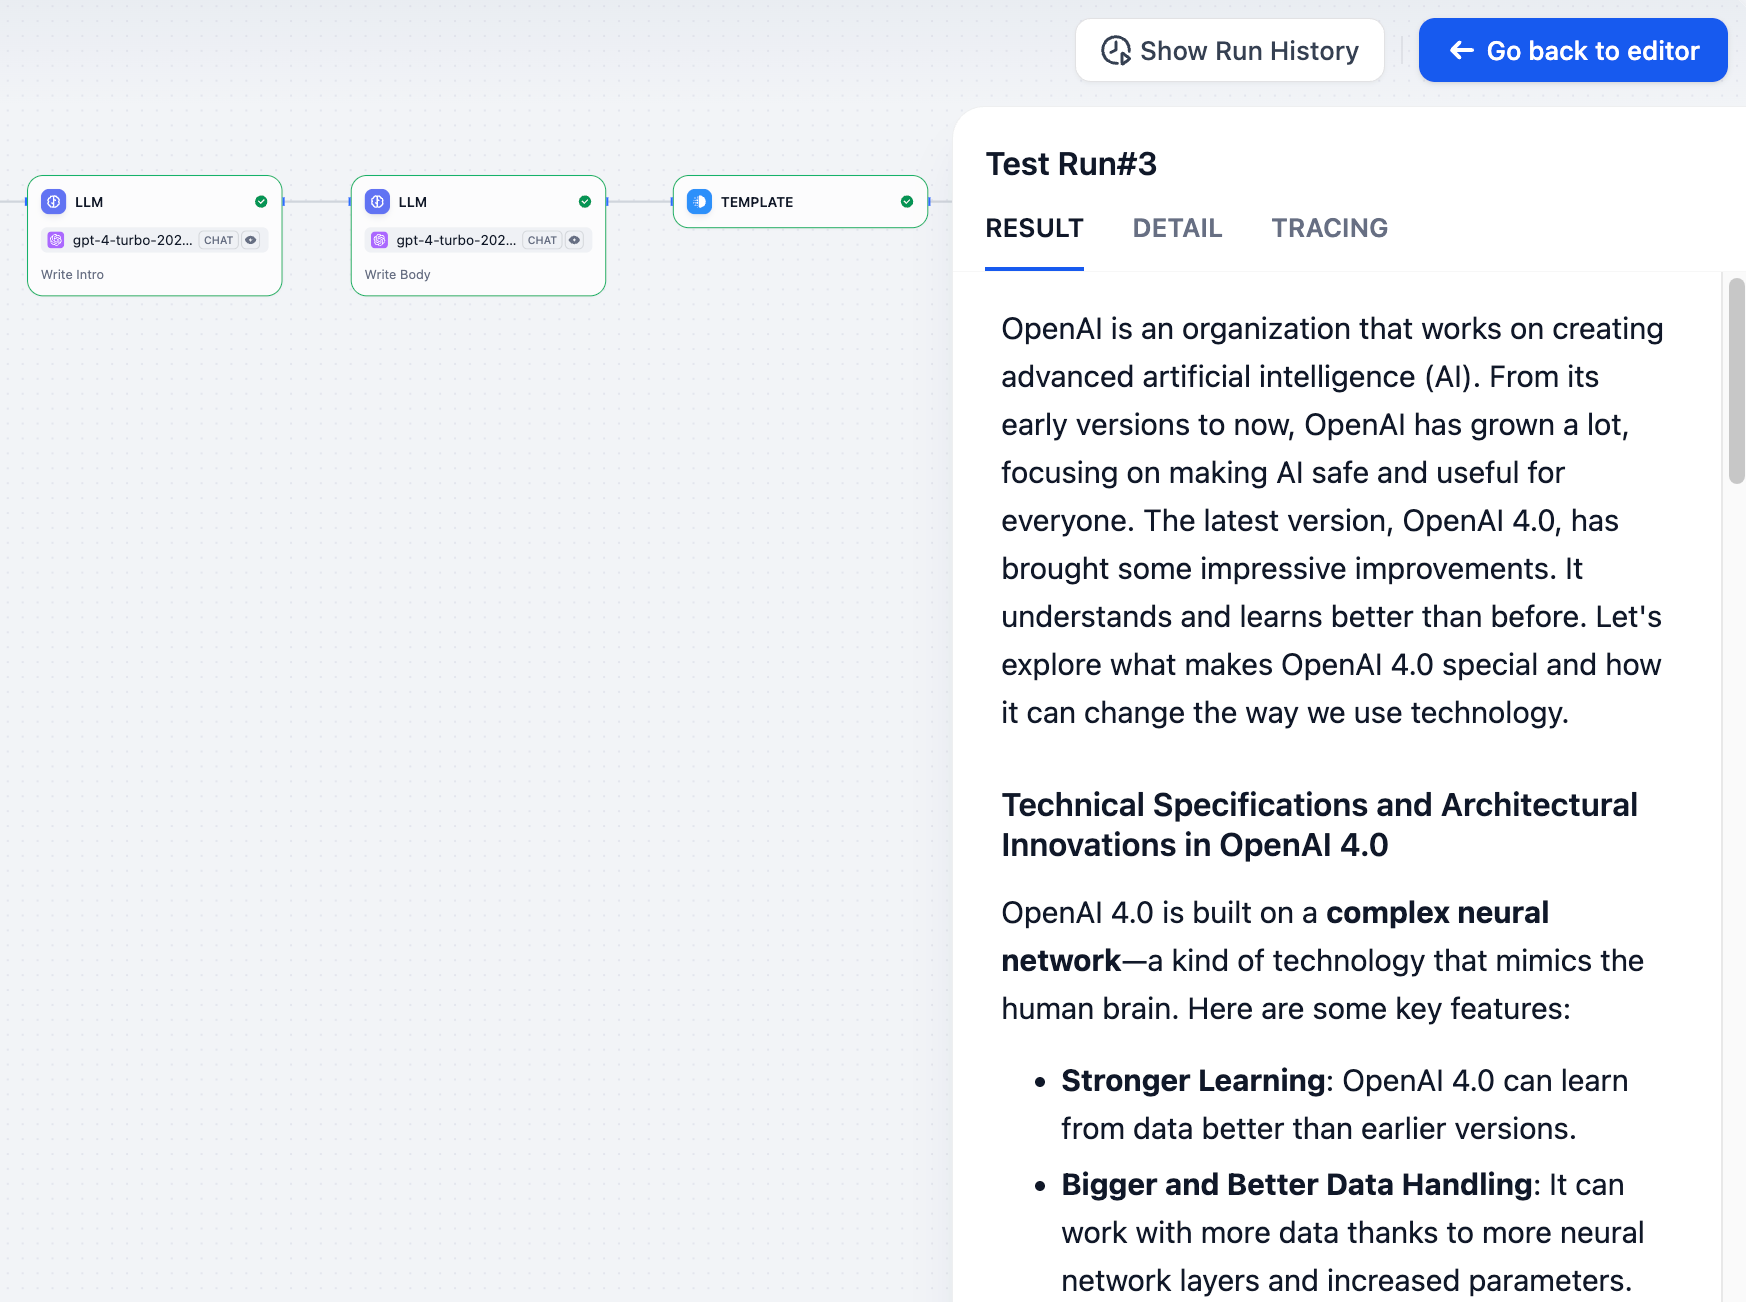
Detail
Shows the original input, final output, and system metadata from the execution.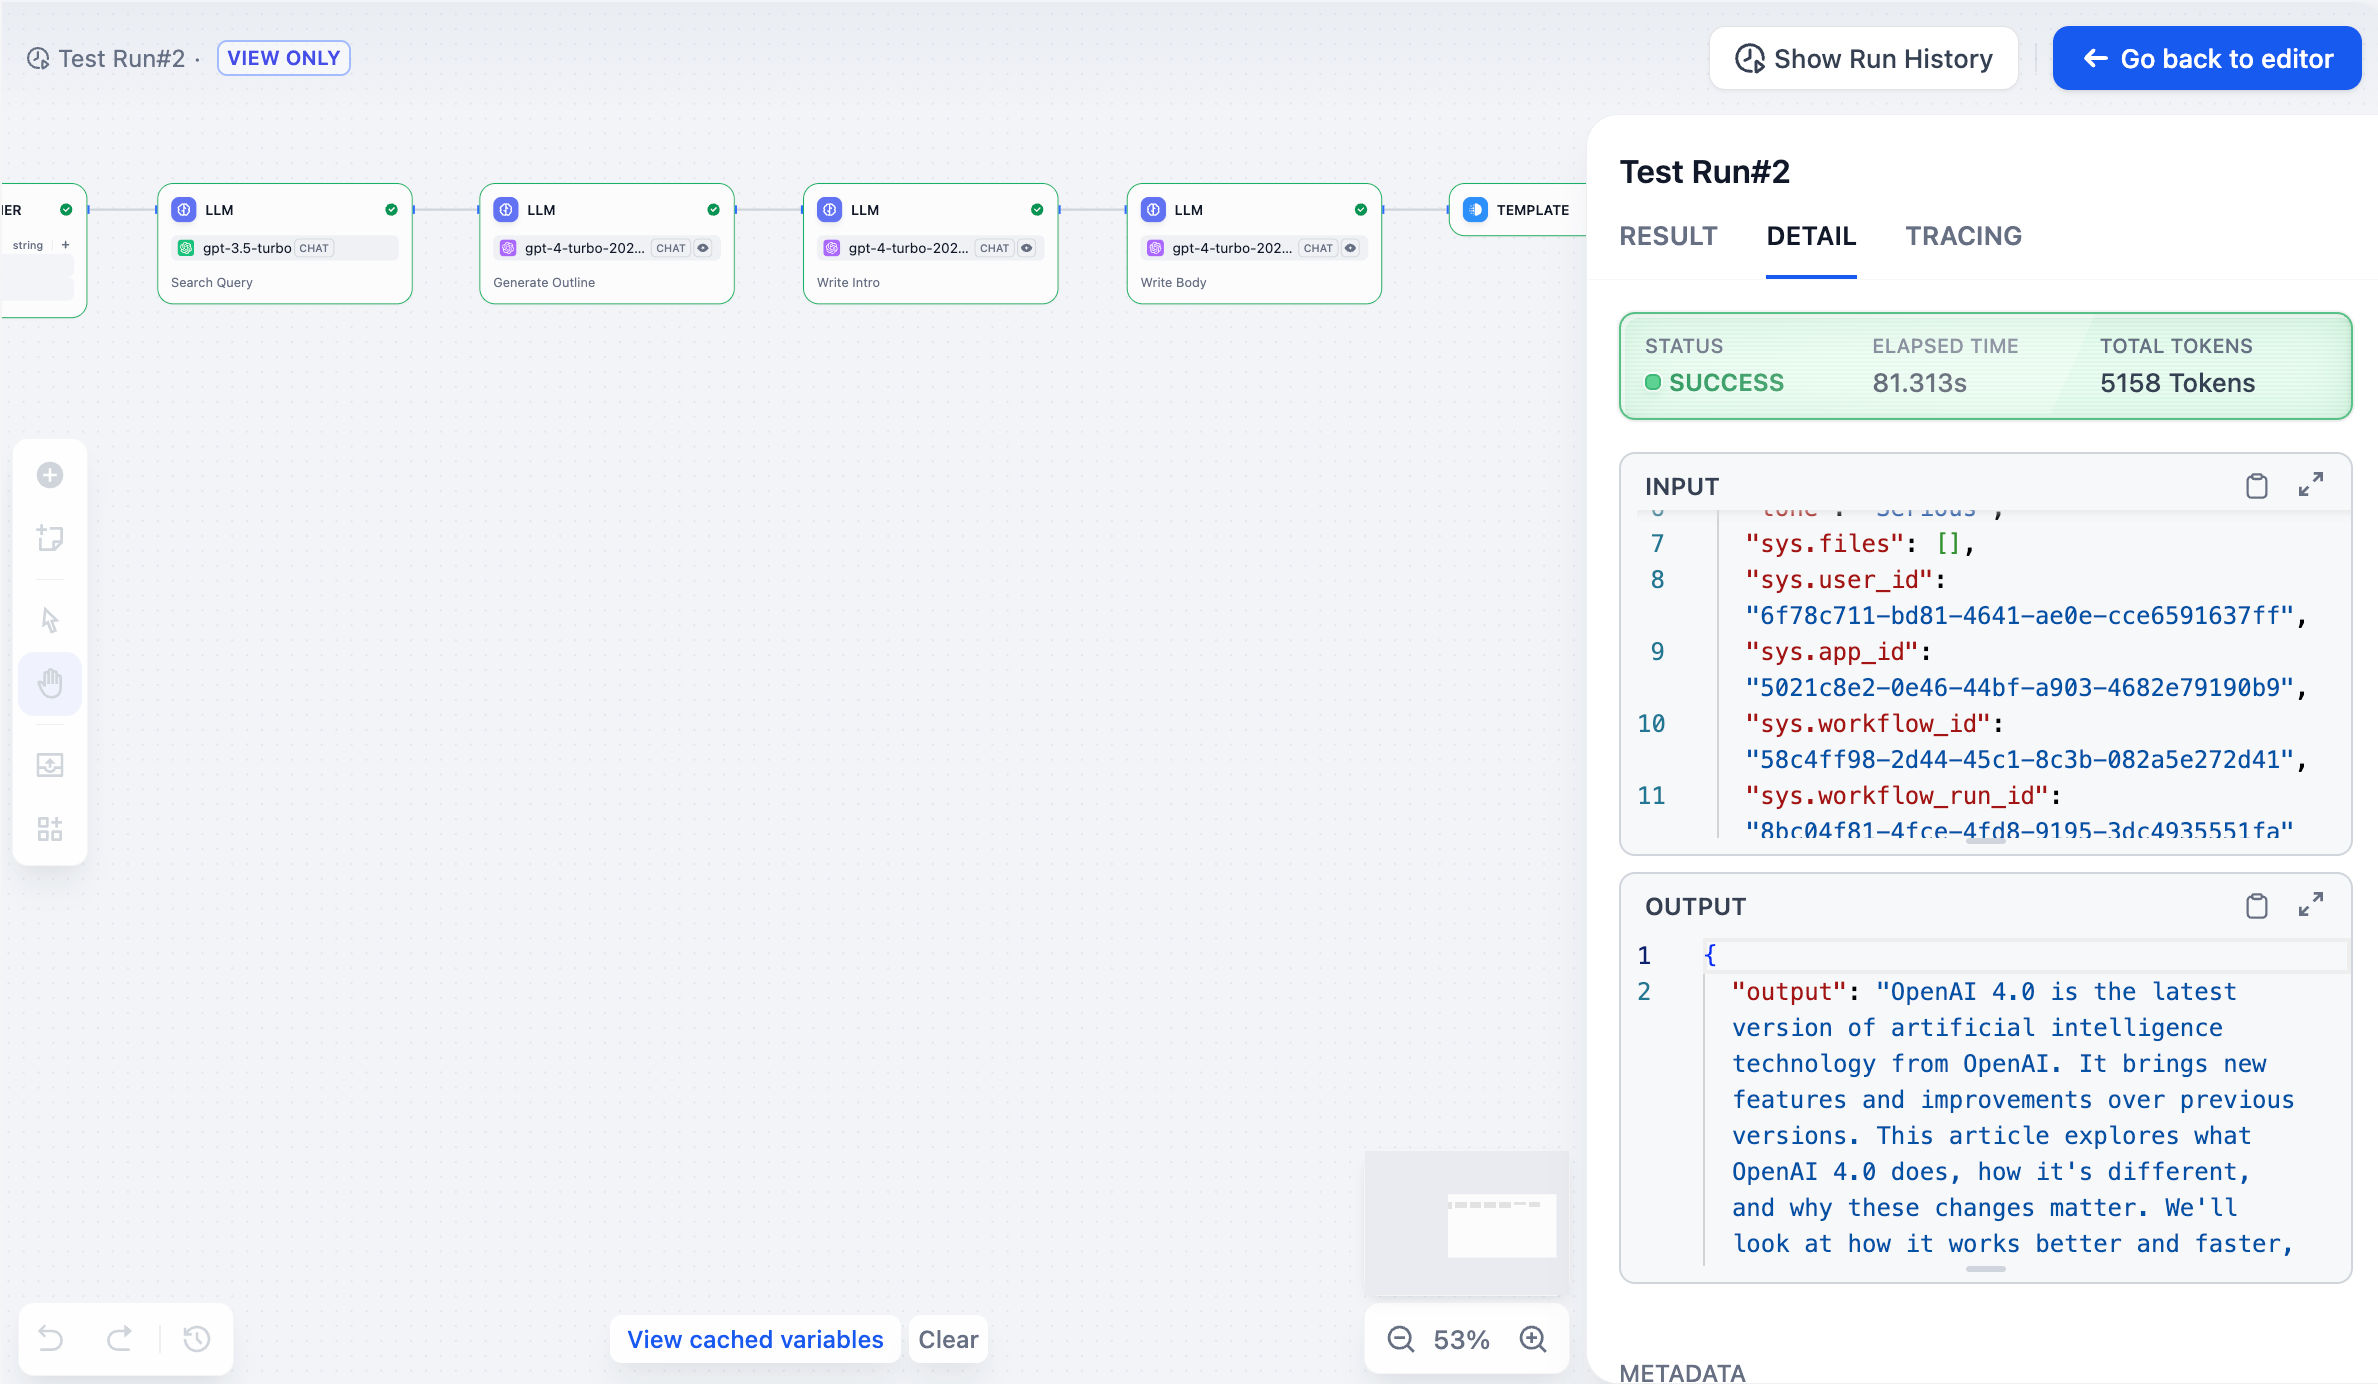
Tracing
Shows exactly how your workflow executed, including which nodes ran in what order, how long each took, and where data flowed between them. This is useful for finding bottlenecks and understanding complex workflows with branches or loops.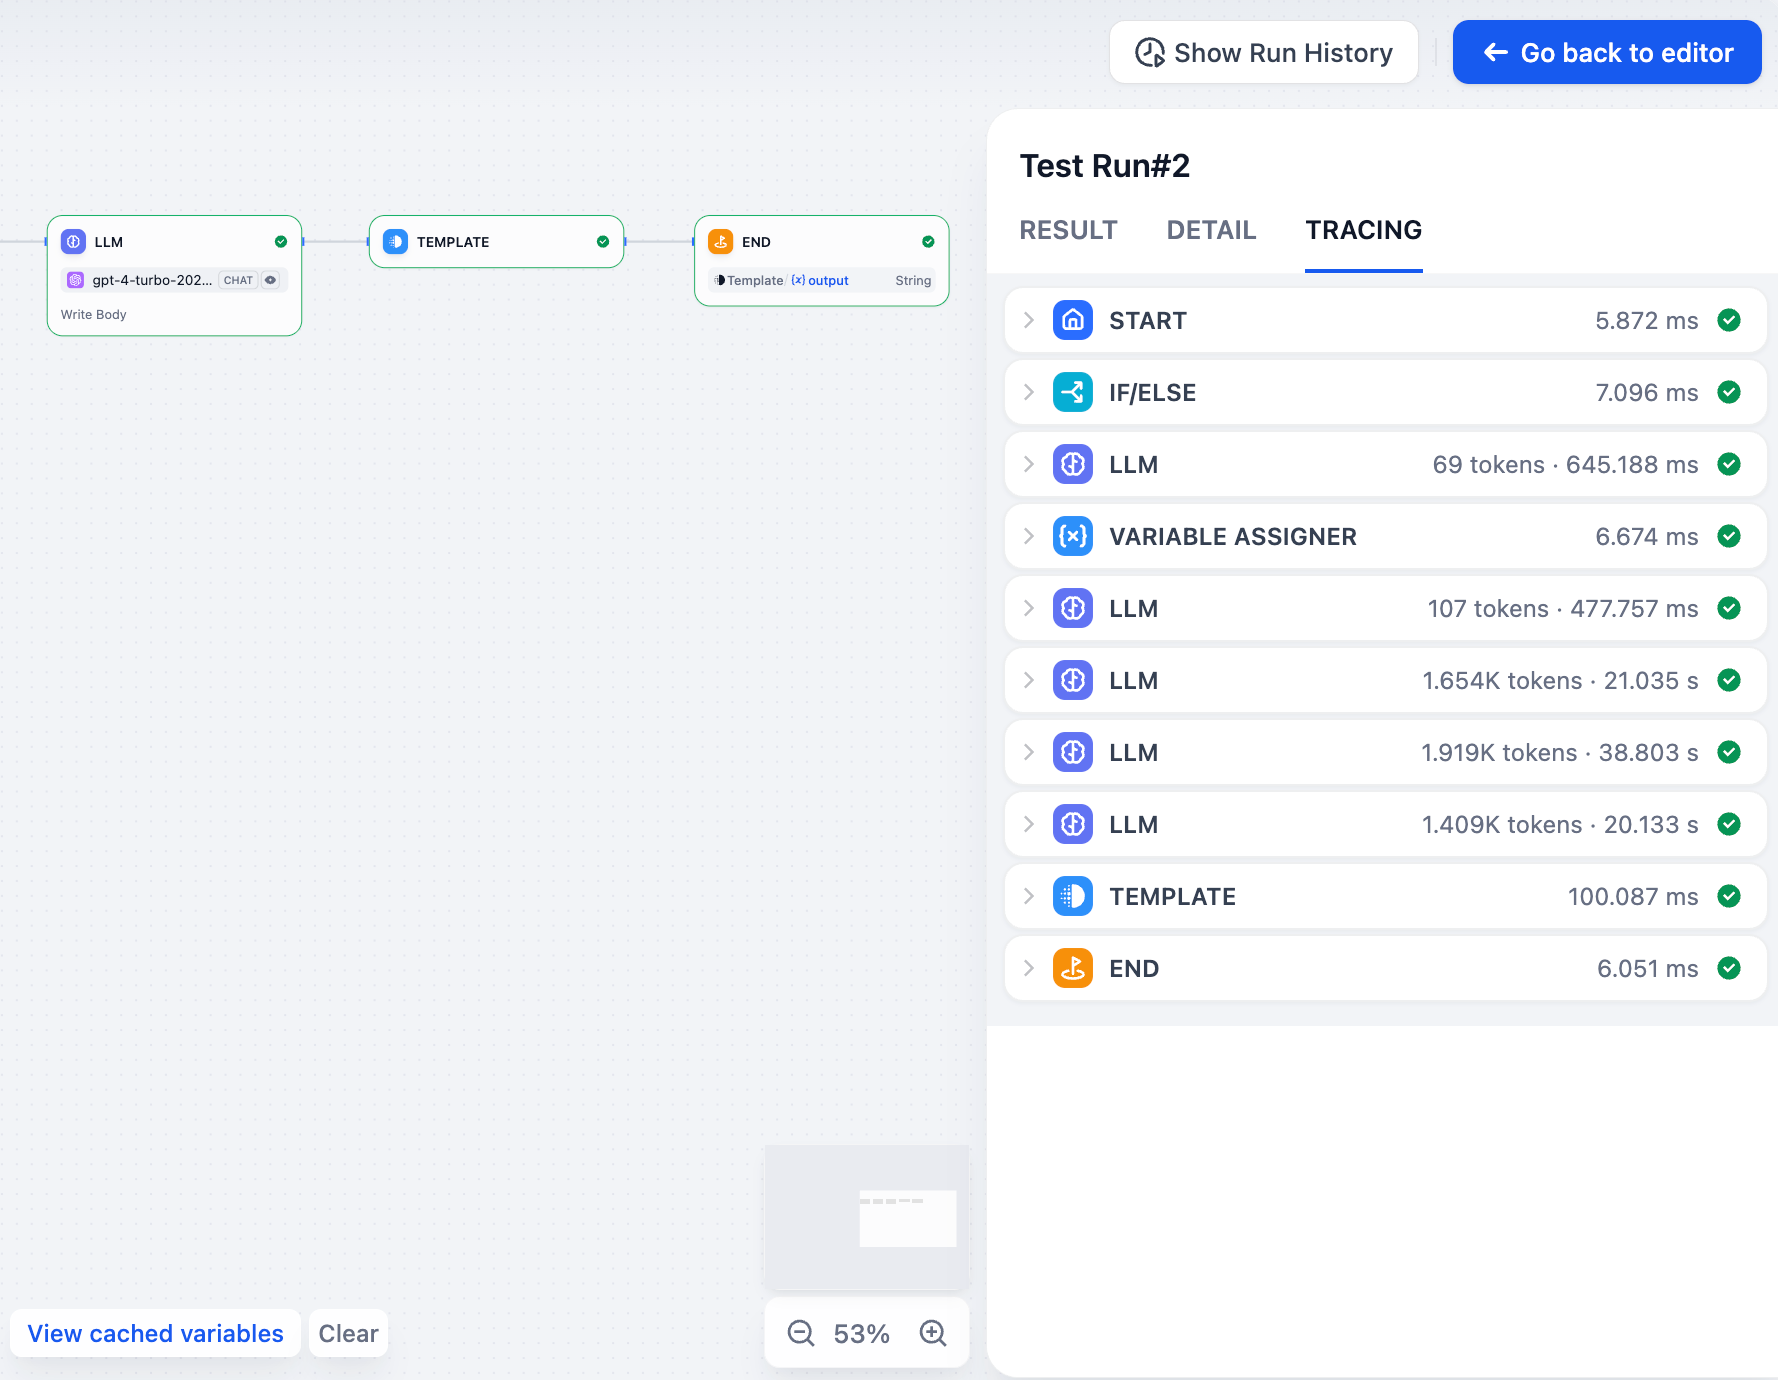
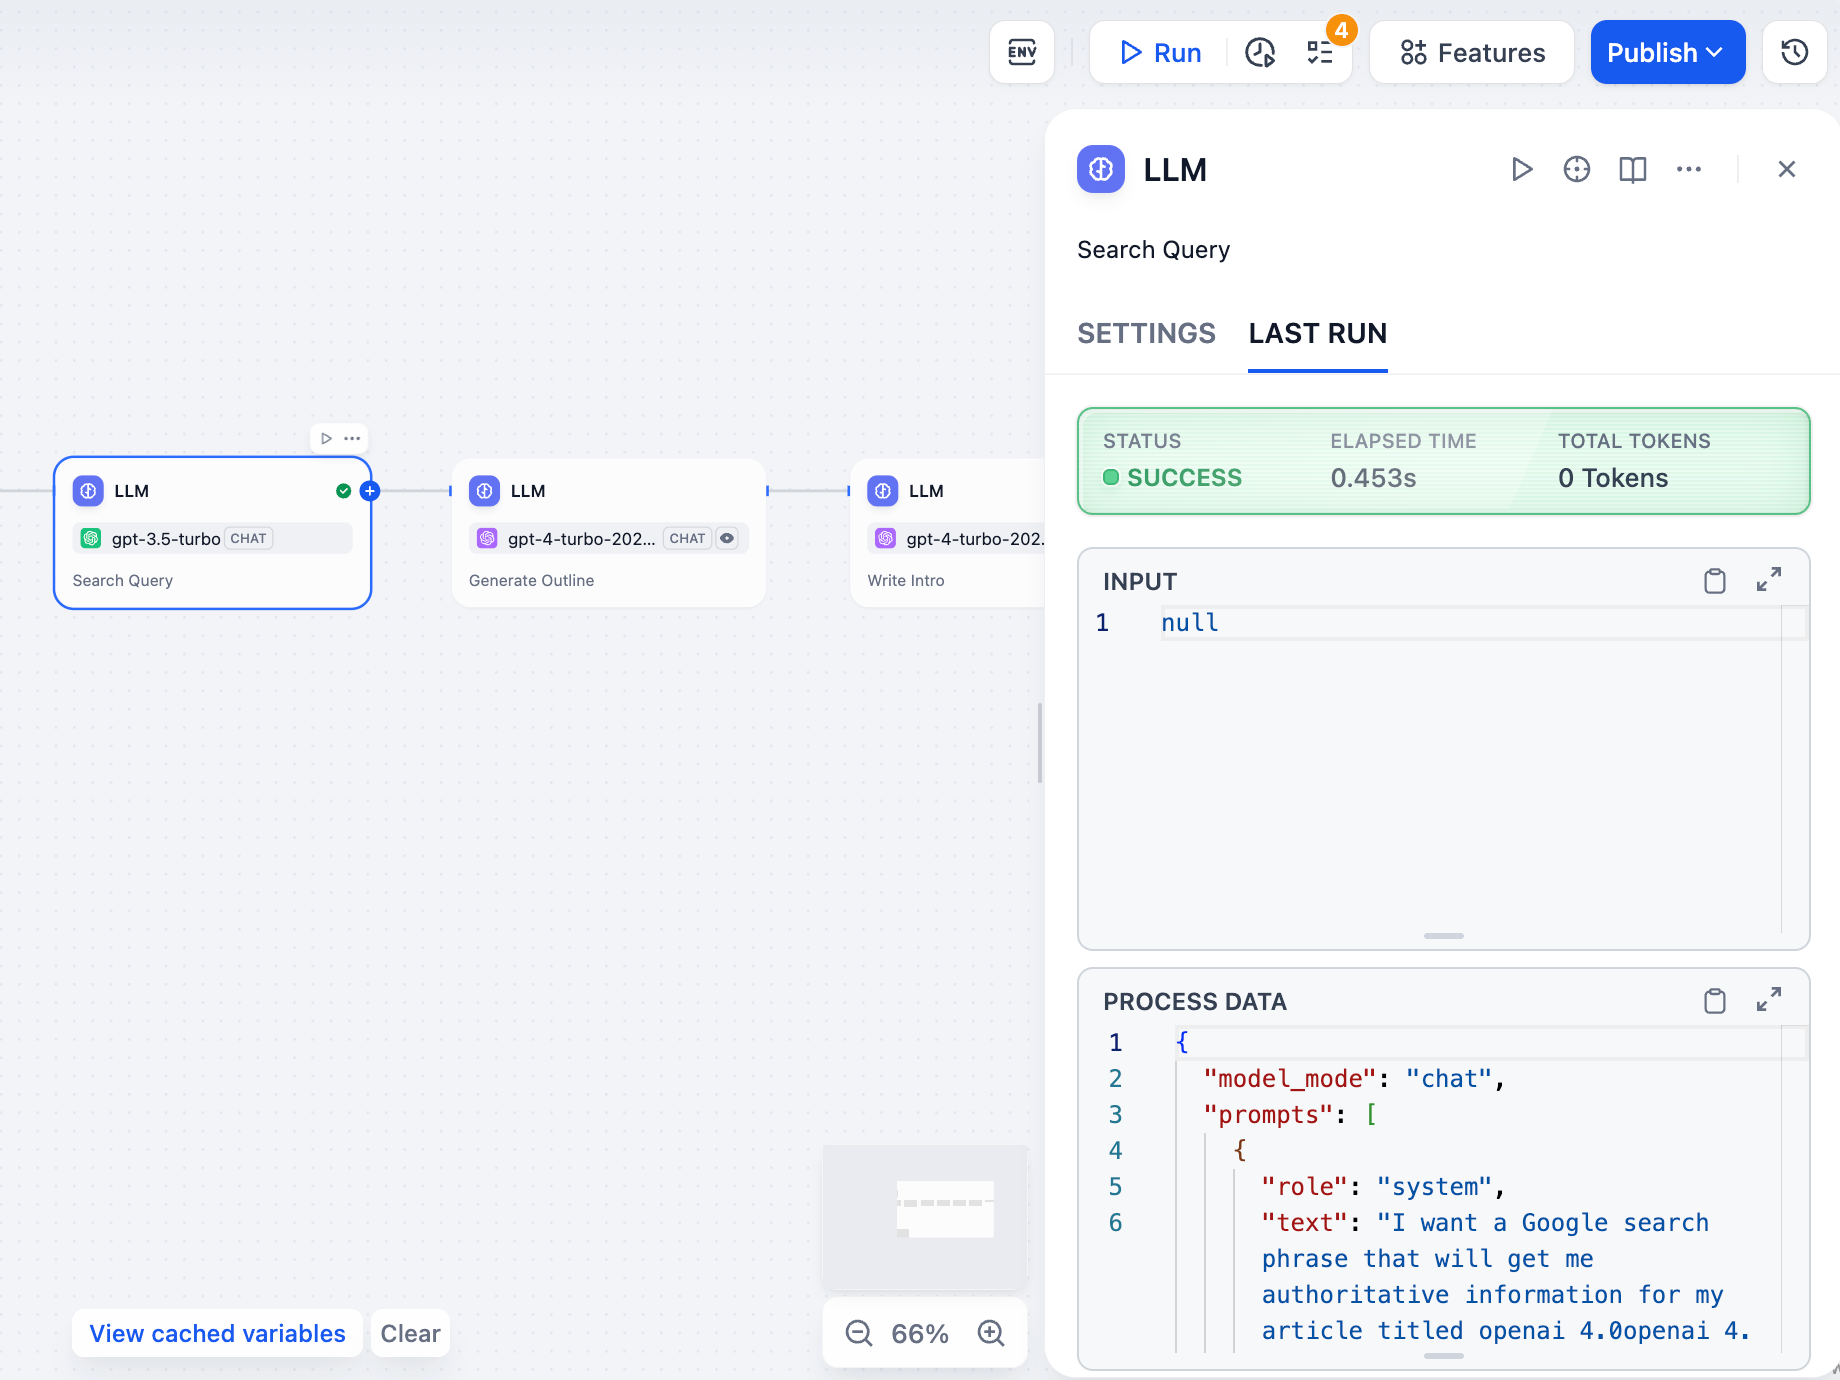
Node Run History
You can also check the last execution of any individual node. Click “Last run” in the node’s config panel to see its most recent input, output, and timing details.